Notion is an incredible tool for organizing data, tracking projects, and managing knowledge. However, when it comes to Notion data visualization, the native capabilities are somewhat limited. If you've ever found yourself asking "How do I make a chart in Notion?" or "How can I generate charts from my Notion databases?", you're not alone.
Product teams, marketers, and founders rely on data to make decisions, but raw tables aren't always easy to interpret. In this guide, we'll show you exactly how to create beautiful, live-updating charts from your Notion databases and embed them seamlessly back into your Notion workspace using Vizelify Charts.
Why Visualize Notion Data?
Connecting your Notion databases to a charting tool like Vizelify Charts allows you to:
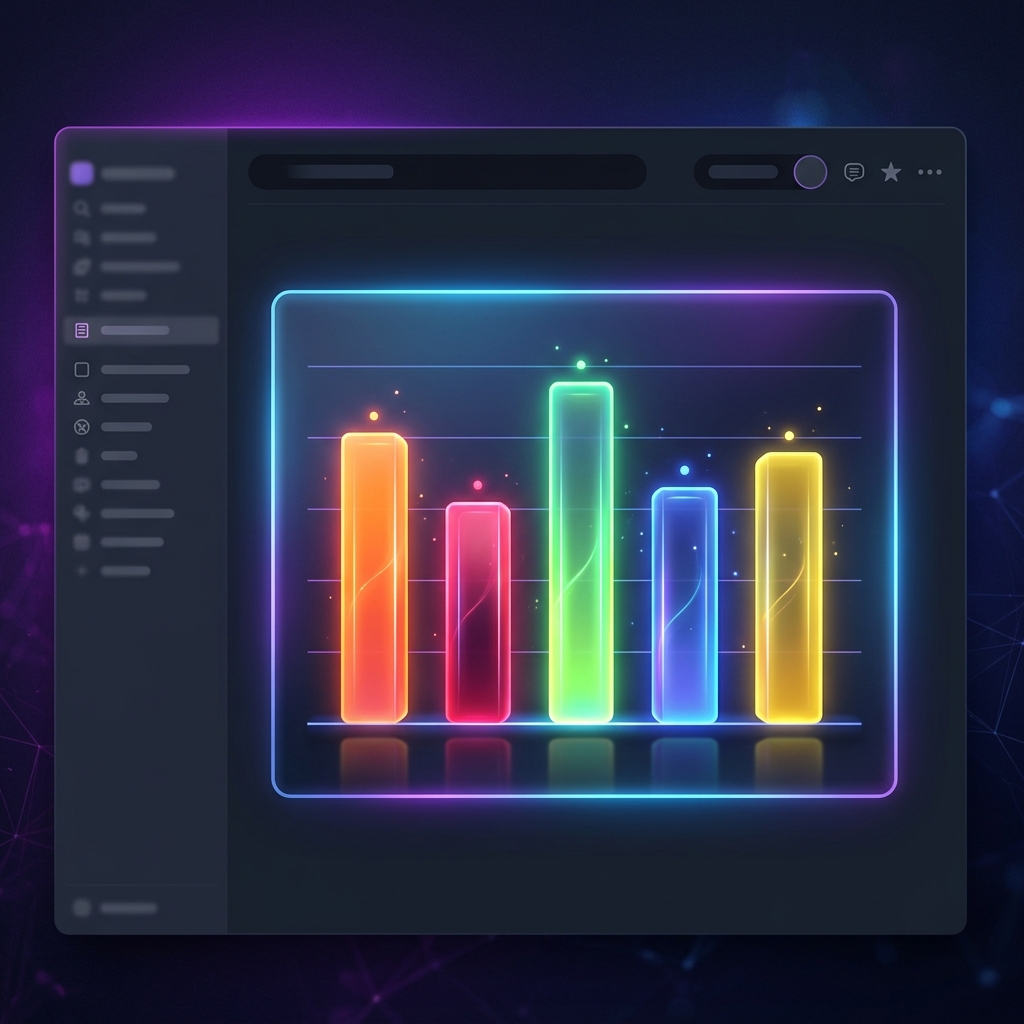
- Build powerful dashboards: Turn plain tables into visual reports (e.g., sales trackers, project progress, budget overviews).
- Automate reporting: Once connected, your charts update automatically whenever your Notion database changes.
- Maintain your brand aesthetic: Apply custom colors and premium SaaS themes (like glassmorphism and soft shadows) to match your company's design system.
Step-by-Step Guide: How to Generate Charts from Notion
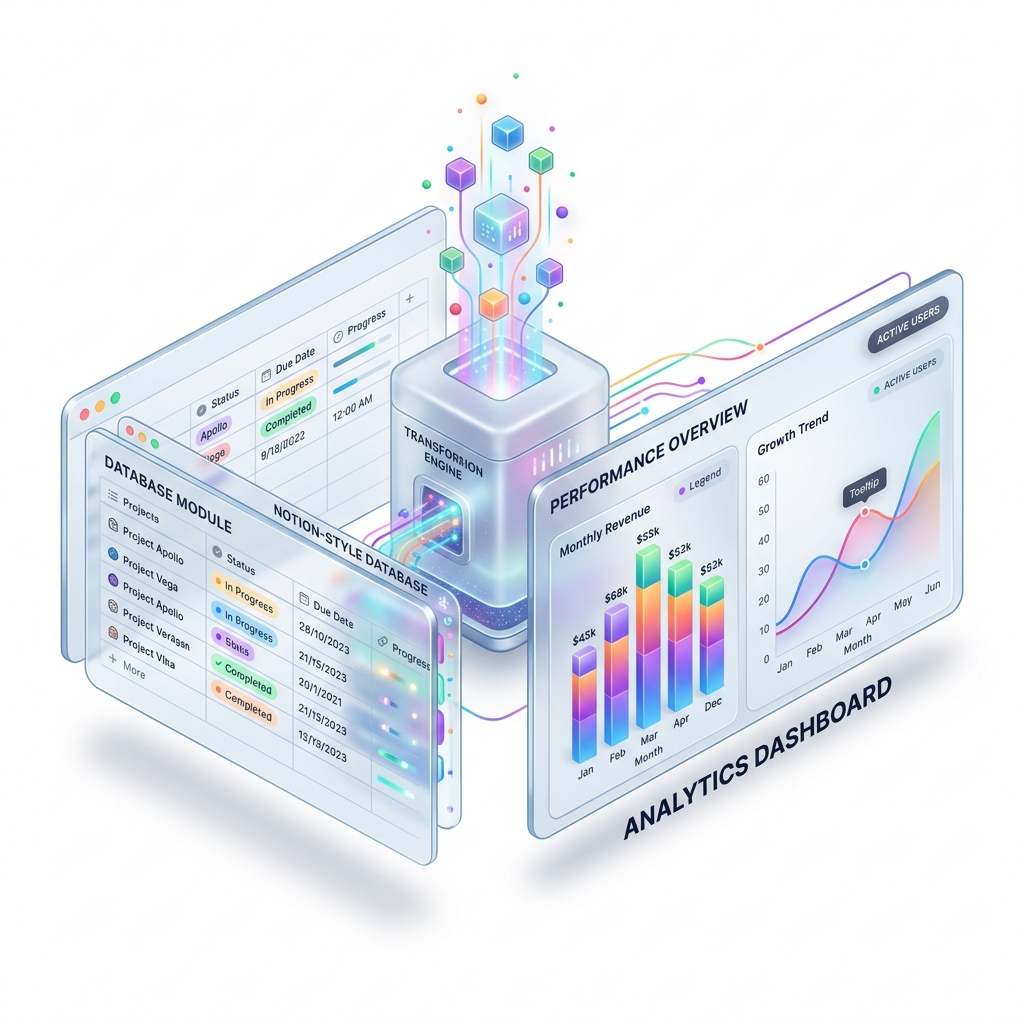
Vizelify Charts integrates directly with the Notion API to fetch your data securely. Here is the complete workflow to go from a raw Notion table to a stunning, embeddable chart.
Step 1: Connect Your Notion Workspace
Before you can generate a chart, you need to authorize Vizelify Charts to read your Notion data.
- Log in to your Vizelify Charts Dashboard.
- Navigate to Data Sources and click on Connect Notion.
- You will be redirected to Notion to authorize the connection. Select the specific pages or databases you want Vizelify Charts to access. Security note: Vizelify Charts only requests read access to the databases you explicitly share.
Step 2: Select Your Database
Once connected, Vizelify Charts automatically indexes the databases you shared.
- Click Create New Chart.
- Select your newly connected Notion workspace as the data source.
- Pick the specific database you want to visualize from the dropdown list. Vizelify Charts will automatically read the columns (properties) of your database.
Step 3: Configure and Customize Your Chart
This is where the magic happens. Vizelify Charts offers a premium no-code builder to map your data perfectly.
- Choose a Chart Type: Select from Bar, Line, Area, Pie, Donut, or more complex types like Heatmaps.
- Map the Axes: Choose which Notion property goes on the X-axis (e.g., "Date" or "Status") and which goes on the Y-axis (e.g., "Revenue" or "Task Count").
- Style It: Use Vizelify Charts's premium styling engine. Apply your brand colors, toggle grid lines, or enable beautiful data labels.
Step 4: Embed the Chart Back into Notion
Once your chart looks perfect, it's time to put it where your team works.
- Click the Share & Embed button in Vizelify Charts.
- Copy the generated Embed URL.
- Go back to your Notion page, type
/embed, and paste the link.
Notion will instantly render the live, interactive chart. As your team updates rows in the Notion database, the Vizelify Charts will reflect those changes automatically!
The Ultimate Notion Dashboard
By integrating Vizelify Charts with Notion, you bridge the gap between raw data and actionable insights. You no longer need to manually export CSVs to Google Sheets just to get a simple bar graph.
Ready to transform your Notion databases into professional-grade analytics dashboards? Start generating for free with Vizelify Charts today.