Higher product adoption.
Teams prototyping with real data visualizations like heatmaps see massive increases in feature adoption and clearer stakeholder buy-in.
From raw data to published chart in 3 steps.
Connect your data source, customize your visualization, and publish — all from one powerful platform.
Connect Your Data
Integrate your favorite data sources — Notion, Google Sheets, CSV, JSON, or APIs — with a single click.
Customize & Brand
Choose from 12+ chart types. Apply your brand colors, fonts, and themes for pixel-perfect consistency.
Share & Embed
Publish with one click. Get embed codes and shareable links that auto-update when your data changes.
Professional and beautiful down to the last detail.
Every feature is built for product teams who need production-ready visualizations from live data — fast.
Always Up-to-Date
Connect your data sources and let charts update automatically — no manual data entry required.
Seamless Collaboration
Access your team's charts and dashboards in one centralized, secure workspace.
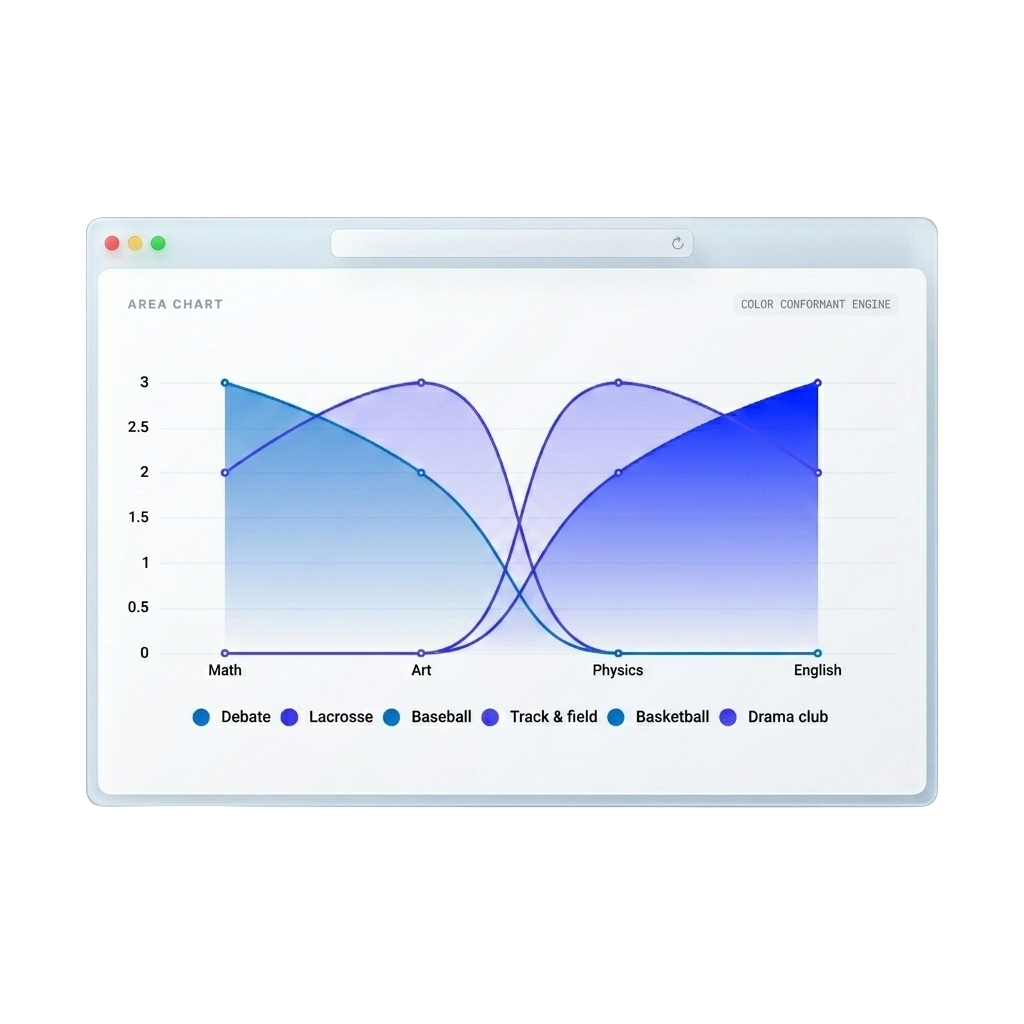
12+ Chart Types
Bar, line, pie, area, scatter, donut, stacked, waterfall, histogram, heatmap, treemap, and more.
Powerful Integrations
Connect Notion, Google Sheets, CSV, JSON, and APIs — with more integrations coming soon.
Safe & Reversible
Never lose a previous iteration. Revert changes instantly without back-and-forth.
Stay On Brand
Custom color palettes and brand kits ensure every chart matches your team's design system.
Embed Anywhere
Get iframe embed codes and shareable links to add interactive charts to any website.
Export PNG & SVG
Download high-resolution PNG or scalable SVG files for presentations, reports, and print.
Have a question?
Let's connect.
Whether you need help getting started or want to discuss enterprise features, our team is here for you.